Assignment 1
- Name: Aadam
- Class: INFO-B 518
- Assignment: 1
A migraine is a particularly painful type of headache, which patients sometimes wish to treat with acupuncture. To determine whether acupuncture relieves migraine pain, researchers conducted a randomized controlled study where 89 females diagnosed with migraine headaches were randomly assigned to one of two groups: treatment or control. 43 patients in the treatment group received acupuncture that is specifically designed to treat migraines. 46 patients in the control group received placebo acupuncture (needle insertion at non-acupoint locations). 24 hours after patients received acupuncture, they were asked if they were pain-free. Results are summarized in the contingency table below.
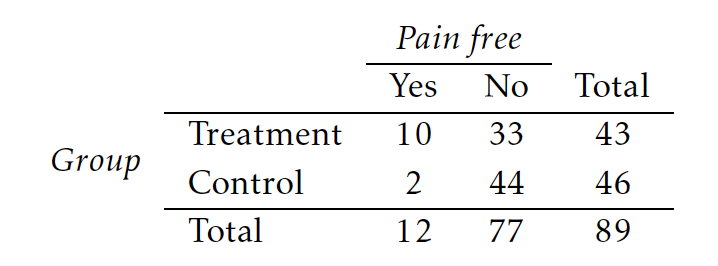
(a) What percent of patients in the treatment group were pain-free 24 hours after receiving acupuncture?
23.26% of the patients were pain-free in the treatment group.
(b) What percent were pain-free in the control group?
4.35% of the patients were pain-free in the control group.
(c) In which group did a higher percentage of patients become pain-free 24 hours after receiving acupuncture?
In the treatment group.
(d) Your findings so far might suggest that acupuncture is an effective treatment for migraines for all people who suffer from migraines. However, this is not the only possible conclusion that can be drawn based on your findings so far. What is one other possible explanation for the observed difference between the percentages of patients that are pain-free 24 hours after receiving acupuncture in the two groups?
It is impossible to tell merely by comparing the sample proportions because the difference could be the result of random error in our sample.
The Buteyko method is a shallow breathing technique developed by Konstantin Buteyko, a Russian doctor, in 1952. Anecdotal evidence suggests that the Buteyko method can reduce asthma symptoms and improve quality of life. In a scientific study to determine the effectiveness of this method, researchers recruited 600 asthma patients aged 18-69 who relied on medication for asthma treatment. These patients were randomly split into two research groups: one practiced the Buteyko method and the other did not. Patients were scored on the quality of life, activity, asthma symptoms, and medication reduction on a scale from 0 to 10. On average, the participants in the Buteyko group experienced a significant reduction in asthma symptoms and an improvement in quality of life.
(a) Identify the main research question of the study.
The main research question of the study is whether Buteyko can reduce asthma symptoms and improve quality of life.
(b) Who are the subjects in this study, and how many are included?
The subjects in the study are asthma patients aged 18-69, and the number of included subjects is 600.
(c) What are the variables in the study? Identify each variable as numerical or categorical. If numerical, state whether the variable is discrete or continuous. If categorical, state whether the variable is ordinal.
- Treatment Group: Categorical nominal variable with two categories: Buteyko group and non-Buteyko group.
- Quality of Life Score: Numerical variable.
- Activity Score: Numerical variable.
- Asthma Symptoms Score: Numerical variable.
- Medication Reduction Score: Numerical variable.
NoteAll of the Score variables above could be either categorized as discrete or continuous, based on the scoring method being used. If the scores are discrete values on the scale of 0 to 10, i.e.
{0, 1, 2, 3, 4, 5, 6, 7, 8, 9, 10}, then all of those variables would be categorized as Numerical Discrete, but given that further information/examples weren’t provided here, so there’s a slight possibility that the score could be real as well, e.g.,5.5or3.4, in which case, the score variables would be Numerical Continuous
Researchers hypothesized that a particular taste receptor in hummingbirds, T1R1-T1R3, played a primary role in dictating taste behavior; specifically, in determining which compounds hummingbirds detect as sweet. In a series of field tests, hummingbirds were presented simultaneously with two filled containers, one containing test stimuli and a second containing sucrose. The test stimuli included aspartame, erythritol, water, and sucrose. Aspartame is an artificial sweetener that tastes sweet to humans but is not detected by hummingbird T1R1-T1R3, while erythritol is an artificial sweetener known to activate T1R1-T1R3. Data were collected on how long a hummingbird drank from a particular container for a given trial, measured in seconds. For example, in one field test comparing aspartame and sucrose, a hummingbird drank from the aspartame container for 0.54 seconds and from the sucrose container for 3.21 seconds.
- Which tests are controls? Which tests are treatments?
Treatment: Hummingbirds presented with test stimuli.
Control: Hummingbirds presented with sucrose only.
- Identify the response variable(s) in the study. Are they numerical or categorical?
The response variable is the duration of time (in seconds) that a hummingbird drinks from a particular container. It is a numerical variable.
- Describe the main research question.
Whether the taste receptor T1R1-T1R3 plays a primary role in dictating tase behavior.
Echinacea has been widely used as an herbal remedy for the common cold, but previous studies evaluating its efficacy as a remedy has produced conflicting results. In a new study, researchers randomly assigned 437 volunteers to receive either a placebo or echinacea treatment before being infected with rhinovirus. Healthy young adult volunteers were recruited for the study from the University of Virginia community.
(a) Identify the population of interest and the sample in this study.
The population of interest isn’t defined explicitly, but we can infer it to be the general human population. The sample in the study consists of the 437 healthy young adult volunteers from the University of Virginia community.
(b) Comment on whether or not the results of the study can be generalized to a larger population.
These results cannot be generalized to a larger population, as the samples were selected from a very specific type of group. If the larger population is assumed to be the young healthy group of people from the community around the University of Virginia, then the results could provide some valuables insights, but for the larger general population, it can’t be considered.
(c) Can the findings of the study be used to establish causal relationships? Justify your answer.
For the broader population, these finding can’t be used to establish a causal relationship. Even though researchers used random sampling for control and treatment groups, the experimental design still suffers from convenience sampling.
In order to assess the effectiveness of taking large doses of vitamin C in reducing the duration of the common cold, researchers recruited 400 healthy volunteers from staff and students at a university. A quarter of the patients were randomly assigned a placebo, and the rest were randomly allocated between 1g Vitamin C, 3g Vitamin C, or 3g Vitamin C plus additives to be taken at the onset of a cold for the following two days. All tablets had identical appearance and packaging. No significant differences were observed in any measure of cold duration or severity between the four medication groups, and the placebo group had the shortest duration of symptoms.
(a) Was this an experiment or an observational study? Why?
This was an experiment, as the participants were assigned to different groups and manipulated.
(b) What are the explanatory and response variables in this study?
Explanatory variables: Type of treatment, i.e. placebo, 1g Vitamin C, 3g Vitamin C, or 3g Vitamin C plus additives
Response variables: The duration and severity of cold symptoms
(c) Participants are ultimately able to choose whether or not to use the pills prescribed to them. We might expect that not all of them will adhere to and take their pills. Does this introduce a confounding variable to the study? Explain your reasoning.
Yes, it does introduce the issue of the confounding variable. If the participants don’t adhere to taking the pills they were prescribed, then they might not experience the potential benefits of the vitamin C, which would ultimately affect the result of the study. Given that this variable can have an effect on the outcome of the study, and it’s not the main focus of the study, so this variable is considered a confounding variable. Researchers need to keep it in mind when designing the experiment, and devise ways to address this potential confounding variable.
A researcher is interested in the effects of exercise on mental health and he proposes the following study: Use stratified random sampling to recruit 18-30, 31-40, and 41-55-year-olds from the population. Next, randomly assign half the subjects from each age group to exercise twice a week, and instruct the rest not to exercise. Conduct a mental health exam at the beginning and at the end of the study, and compare the results.
(a) What type of study is this?
This is an experimental study, as the researchers are able to directly influence how the data arises.
(b) What are the treatment and control groups in this study?
Treatment Group: Group that exercises twice a week
Control Group: Group that is not allowed to exercise
(c) Does this study make use of blocking? If so, what is the blocking variable?
Yes, it does make use of blocking. The blocking variable is the age group (18-30, 31-40, and 41-55).
(d) Comment on whether or not the results of the study can be used to establish a causal relationship between exercise and mental health, and indicate whether or not the conclusions can be generalized to the population at large.
This study can be used to establish a causal relationship between exercise and mental health. The experimental design uses random assignment of individual to treatment and control group, which would help in controlling the confounding variables. If the age groups and the sample size are representative of the broader population, then this can be used to generalize to the population at large, but its generalizability to other age groups or populations not included in the study may be limited.
(e) Suppose you are given the task of determining if this proposed study should get funding. Would you have any reservations about the study proposal?
Although the proposed study has some strengths, some further points should also be addressed. The sample size of the study isn’t specified, and a small sample size could cause problems here. We also need to consider if the participants will adhere to the exercise regimen they are assigned, and need to figure out ways to monitor that. Also, restricting one group from exercising could have some ethical concerns as well. So, we need a better experimental design for this.
For each part, compare distributions (1) and (2) based on their means and standard deviations. You do not need to calculate these statistics; simply state how the means and the standard deviations compare. Make sure to explain your reasoning. Hint: It may be useful to sketch dot plots of the distributions.
(a)
(1) 3, 5, 5, 5, 8, 11, 11, 11, 13
(2) 3, 5, 5, 5, 8, 11, 11, 11, 20
The mean of (2) is slightly bigger than the mean of (1) because of the last entry in the array, i.e., \(20\).
The standard deviation is also a little bit more in case of (2) because of the same last entry in the array.
`(1) -20, 0, 0, 0, 15, 25, 30, 30
(2) -40, 0, 0, 0, 15, 25, 30, 30
Because of the first entry in the array, the mean of the (1) would be bigger than the (2) and the standard deviation would be less.
(c)
(1) 0, 2, 4, 6, 8, 10
(2) 20, 22, 24, 26, 28, 30
In this case, the standard deviation of both distributions would be the same because they are being incremented by the same amount, although the mean of (2) would be a lot bigger than (1), as it consists of larger numerical values.
(d)
(1) 100, 200, 300, 400, 500
(2) 0, 50, 300, 550, 600
In this case, the mean of both distributions is the same while the standard deviation of (2) is a lot bigger as the range of its values is bigger than (1), i.e., from 0 to 600.
Daily air quality is measured by the air quality index (AQI) reported by the Environmental Protection Agency. This index reports the pollution level and what associated health effects might be a concern. The index is calculated for five major air pollutants regulated by the Clean Air Act and takes values from 0 to 300, where a higher value indicates lower air quality. AQI was reported for a sample of 91 days in 2011 in Durham, NC. The relative frequency histogram below shows the distribution of the AQI values on these days.
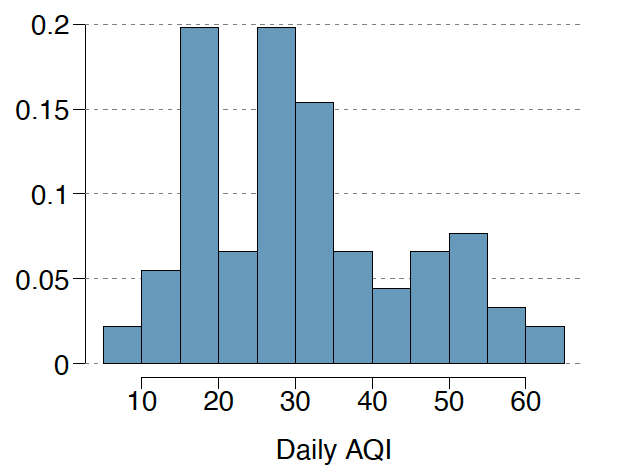
(a) Based on the histogram, describe the distribution of daily AQI.
By looking at the distribution, we can see that the data trails off to the right side. Based on that, we can conclude that it is a right-skewed distribution.
(b) Estimate the median AQI value of this sample.
The median is approximately 30.
(c) Would you expect the mean AQI value of this sample to be higher or lower than the median? Explain your reasoning.
Given that this AQI distribution is skewed right, meaning that the mean will be influenced by the higher values, I would expect the mean AQI value to be higher than the median.
910 randomly sampled registered voters from Tampa, FL were asked if they thought workers who have illegally entered the US should be (i) allowed to keep their jobs and apply for US citizenship, (ii) allowed to keep their jobs as temporary guests workers but not allowed to apply for US citizenship, or (iii) lose their jobs and have to leave the country. The results of the survey by political ideology are shown below.
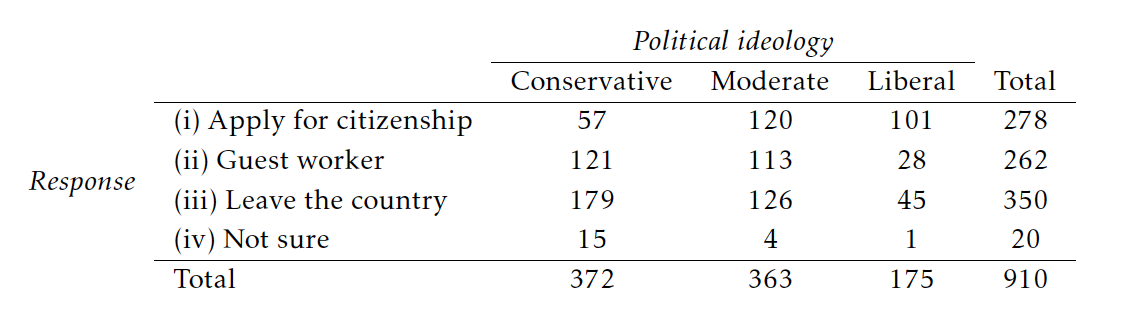
(a) What percent of these Tampa, FL voters identify themselves as conservatives?
\(372/910 = 40.88\%\)
(b) What percent of these Tampa, FL voters are in favor of the citizenship option?
\(278/910 = 30.55\%\)
(c) What percent of these Tampa, FL voters identify themselves as conservatives and are in favor of the citizenship option?
\(57/910 = 6.26\%\)
(d) What percent of these Tampa, FL voters who identify themselves as conservatives are also in favor of the citizenship option? What percent of moderates share this view? What percent of liberals share this view?
Conservatives: \(57/372 = 15.32\%\)
Moderates: \(120/363 = 33.06\%\)
Liberals: \(101/175 = 57.71\%\)
Indicate which of the plots shows a
positive association.
negative association.
no association.
Also, determine if the positive and negative associations are linear or nonlinear. Each part may refer to more than one plot.
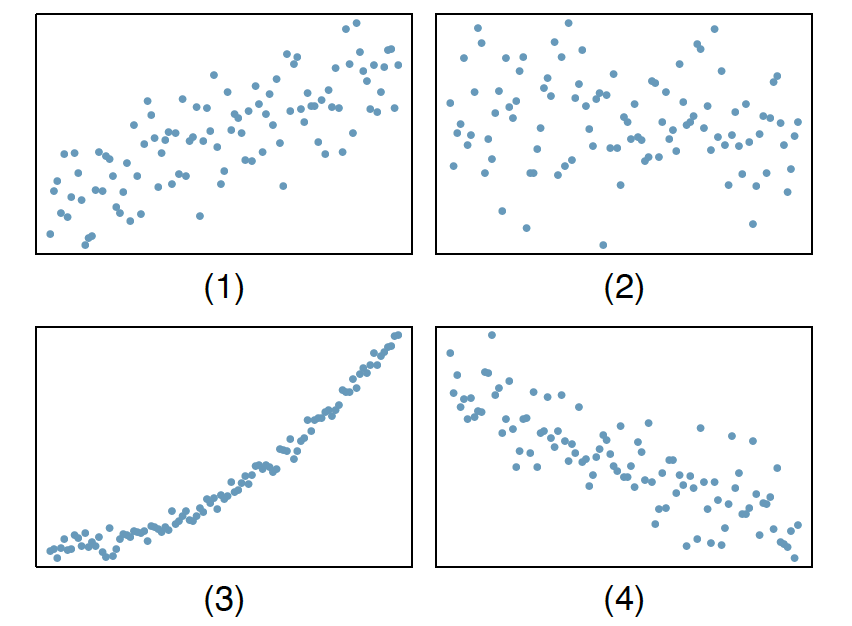
Plot (1) Shows positive linear association
Plot (2) Shows no association
Plot (3) Shows positive non-linear association
Plot (4) Shows negative linear association